In 2023, I coordinated a team of analysts to build a dashboard for a large Supply Chain company. The process was entirely manual. I located 100 competitors (of varying sizes) via desk research and wrote down their revenues on an Excel sheet. This step alone took a month to build with a team of 3. By aggregating the data, the team produced a full market share and market size dashboard. It was shown to the board and the tool was used to reshape the regional strategy of the company.
Market sizing has been the central question in every CDD and growth project I have run since then; answered either by teams manually extracting financials from Companies House or by paying five-figure subscriptions to platforms like Pitchbook.
By creating our own products, we accomplished three things: cost reduction, an auditable methodology, and proprietary processes. I no longer pay for a database provider, which can run between $10,000 and $70,000, because I can show that each data point was created from reputable open sources, and I control the process. The tool took around a month to develop and requires careful testing to avoid errors.
This has provided the firm with some credibility in a market where methodology is often opaque, and it has also provided a systematic paper trail that is not yet offered by large players or the data providers they use. It doesn’t give us a strategic edge per se, but reassures clients, in the same way that knowing how to size a market and build a discounted cashflow model is theoretically something anyone with an Excel account could do, but you wouldn’t hire just anyone to do it.
An Automated market sizing product
The hidden cost in every CDD and strategy project is not the analysis. It has always been data collection and cleaning. For any basic mid-market segment that means opening 30-100 PDFs with financials in all formats, and writing them down in Excel. The data platforms/aggregators do the same thing in the background, but they run at a substantial cost. In the UK case in particular this was made the more painful as the PDFs from Companies House were an image and could not be quickly scanned. Before any analysis was done, you had already spent 2-3 analysts days just to build one slide. This process is also prone to error and costly to properly audit. Most Excel sheets don’t easily keep track of the name of the PDF and the page where the information was taken from.
What we have developed takes one or multiple SIC codes, queries the Companies House bulk CSV (5.7 million companies) to generate a company landscape. It scans all the relevant Companies House PDF financials, finds income statement automatically by keyword detection and extracts the financials. It finally calculates the market sizing using a bottom up methodology and produces a branded Excel output and an HTML dashboard. The tool goes from raw PDFs (1,000 pages of them) to producing a branded output that is client ready. We have since validated it across grocery retail, logistics, energy sectors and a variety of mid-market segments that need to be kept secret for confidentiality reasons.
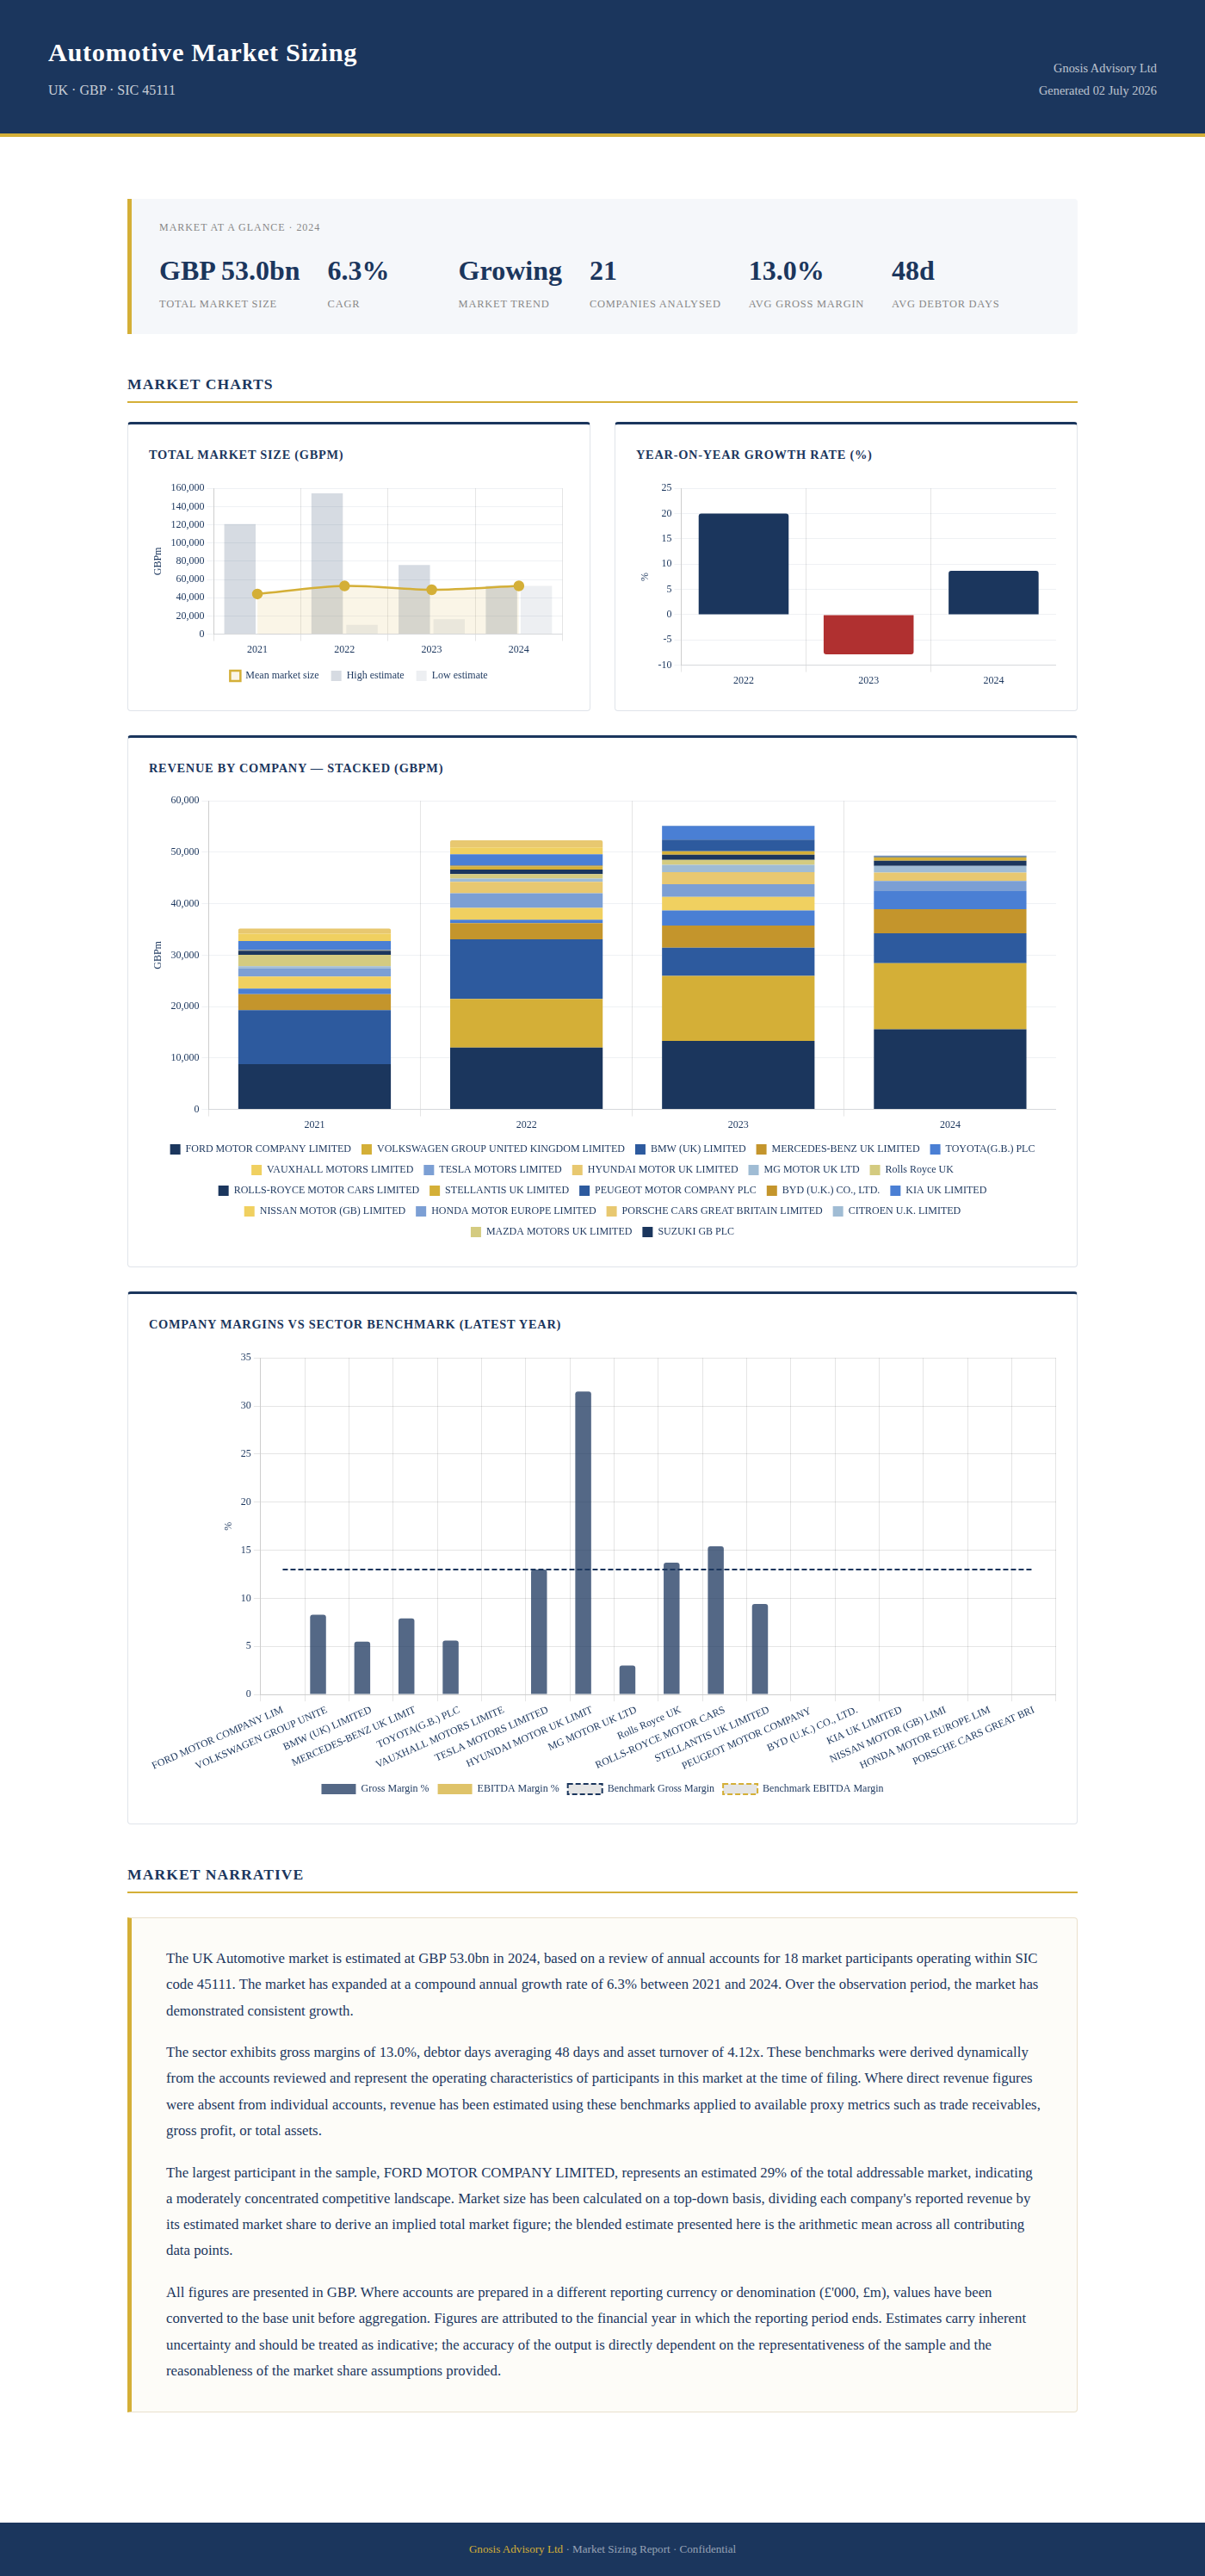 Image 1. Market sizing output of the Automotive Manufacturing sector.
The main hurdles.
The tool was not “Vibe Coded” (i.e. prompted Claude to build a solution that looks polished but cannot be verified) but rather tested and applied to real markets with existing market data. The main issues we had to face were threefold: reading data from documents, recording it at scale, and creating estimation benchmarks for unavailable data.
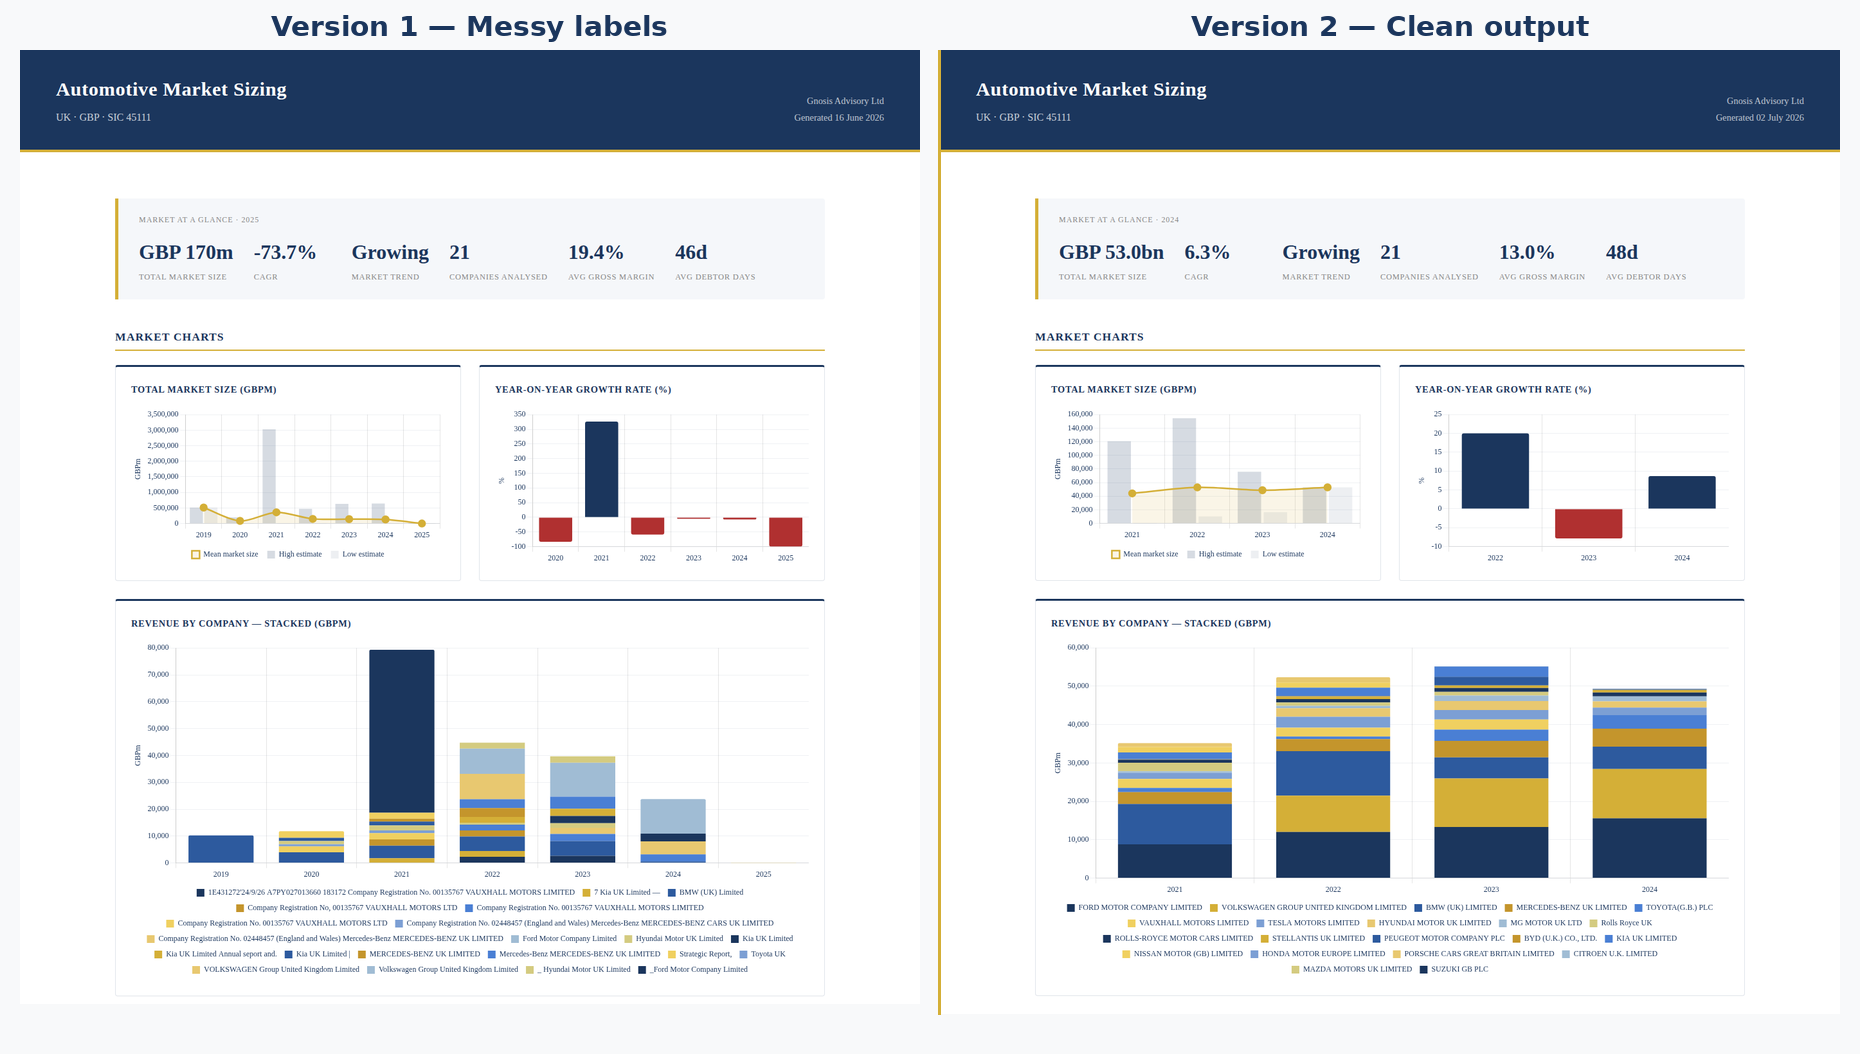 Image 2. Version 1 vs. Version 2, the need for stress testing.
How to read an image at scale.
Most of the files on Companies House are downloadable as images on a PDF format that is not searchable. The only way to obtain a financial figure automatically is by scanning a wide range of financial declarations that are never structured in the same way; of which most of it is absolutely irrelevant. So, the trick was creating a solution that could transform 40-140 pages of PDFs into text, selecting where the financials were located and disregarding most of the rest. Although any LLM is fully able to read images and get information from them, it becomes a problem when you have to scan over 1,000 pages of raw PDFs. Most chats will not allow it, and if you broke them down as images it would cost a substantial amount of money in tokens just to get to the result. This is not practical for cost reasons in the current state of models, and as the models become more voracious in their use of tokens, image reading will still be costly. The solution was creating an OCR reader that recognised text and optimised for speed. But that created a second difficulty around recording data at scale to create readable databases.
Recording data at scale
The main issue is that all the financial reporting on Companies House has unstructured reporting (and we already established that an LLM approach to analyse all this data is costly). Documents have a different format even if they share a semantic architecture. A person reading a report can easily identify that the P&L reporting is on p.25 one year and p.28 the other. For a machine, this is a considerably more complex task.
The way we solved this was creating a multi-step data analysis algorithm. It first ensured each PDF was matched to a specific company (linking it to a unique identifier: the Companies House number). This is particularly robust, given that it connects to the full Companies House CSV (over 5.7 million lines). This step was essential for year on year analysis and referencing. The unique identifier algorithm helped create a searchable database, but was not enough to identify where the data was located.
Secondly, we created a mechanism to locate the financial data. The main issue was compute time. We were able to move from c. 1 hour of PDF scanning and data reporting for large firms (over multiple years) to c. 5 minutes. The result is a coding mechanism that locates financial data instantly as well as any reported financial metrics.
The last hurdle was discerning which data points to gather in a document full of financial information and with a wide range in how figures are reported (from million pounds to full pounds).
This makes for a compiled database of companies that can be reused once it has been run once, thus reducing the cost of running the tool again to any marginal additions.
Estimating non-provided numbers.
Once the tool creates the database, it can then interpolate missing data based on industry benchmarks coming from the market data created by the tool itself. The raw output clearly identifies which data point is estimated and which figure is reported, because it keeps track of the page and the file where each data point was obtained; providing full auditability at the point of extraction.
From raw PDFs to client-ready output
The tool reads PDFs and provides a full market database. This is fundamentally a cost saving mechanism of tens of thousands of pounds annually. It allows us to run data analysis at scale without relying on large data platforms, in a fully auditable way. It is also replicable to other use cases that we have now tested. We can obtain financial information on a company from its raw PDFs instantaneously. This fully automates the market sizing and company financial data processing in sectors with no aggregated data and unpublished reports.
The most significant implication of this tool is that it produces the same underlying data as leading platforms like Pitchbook or Beauhurst at project cost rather than subscription cost, with full auditability of every figure. A firm currently paying £30,000 to £70,000 annually for platform access should ask whether that expenditure is justified when the same data can be generated on demand, traced to its source, and delivered as part of a branded client output. This changes the economics of the work itself. The cost of the tool is absorbed into project delivery and it becomes a variable cost. This is particularly important in cyclical industries like M&A advisory and professional services. Because of this, smaller firms and mid-market PE funds can now commission market sizing and granular financial analysis at the company level that was previously only viable for the largest projects. The constraint is no longer cost. It is knowing which question to ask.
Inside the consulting team, the change is equally structural. A junior learns to operate and refine the tool rather than spending weeks transcribing PDFs. The conversation between analyst, manager, and director shifts entirely to interpretation: which trends matter, which assumptions need stress-testing, and which findings change the thesis. That is where the value has always been. The tool just makes it the only place the team needs to spend its time.